Understanding Alarms on SolarVu® - Get Notified
Ensuring the right stakeholders and contacts are informed of potential site issues affecting data collection or site production is a crucial first step in managing your sites connected to Cachelan.
This section will guide you through an introduction of how Alarms on Cachelan SolarVu® Portals work, how to set up email addresses of yourself, other colleagues or external stakeholders to receive alarms as they occur on SolarVu®, how to interpret and understand the different types of alarms, and provide key steps you can take when you receive an Alarm Email, so you can diagnose the issue and get assistance from the Cachelan Tech Support team in getting to the bottom of the issue.
SolarVu® Portal’s enter alarm states for various reasons (non-green ‘System OK’ lights), and when something is determined to require attention, it enters the portal’s ‘Alarm Log’/’Error Log’ list, which displays a history of alarms that have occurred on the portal in the last 30 days. Each new ‘Alarm Log’ entry on a portal will be sent to email addresses registered on the portal to receive ‘Alarm Emails’.
Main Categories of SolarVu® Portal Alarms
Communication Alarms
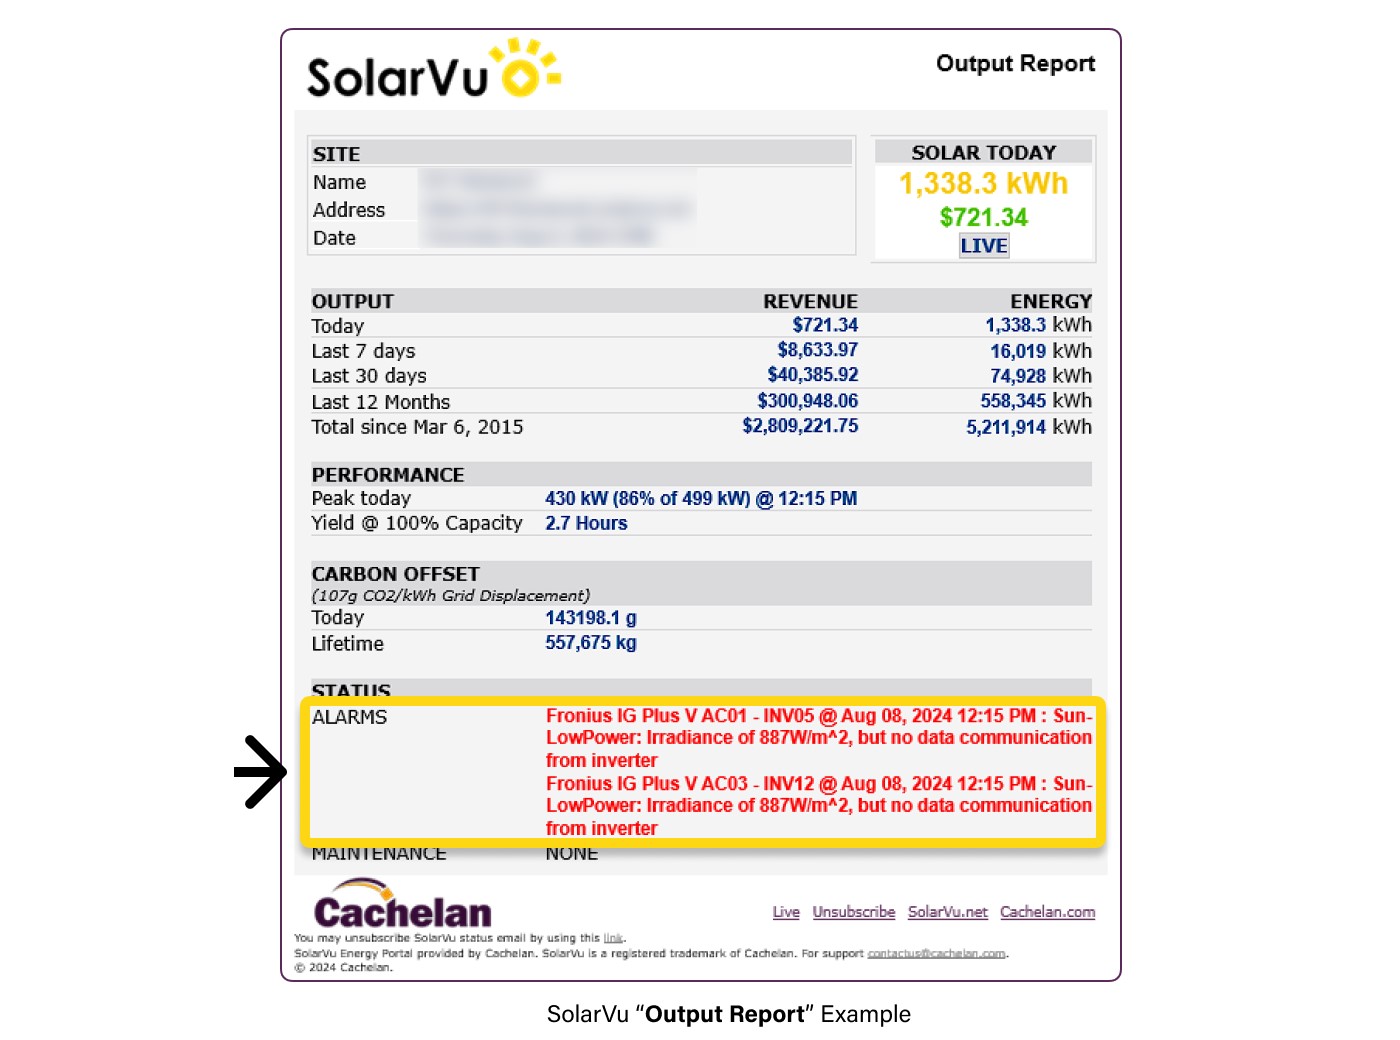
Can be seen in the Daily and Monthly Report Emails, Email Alarms and on the SolarVu® Portal Dashboard.
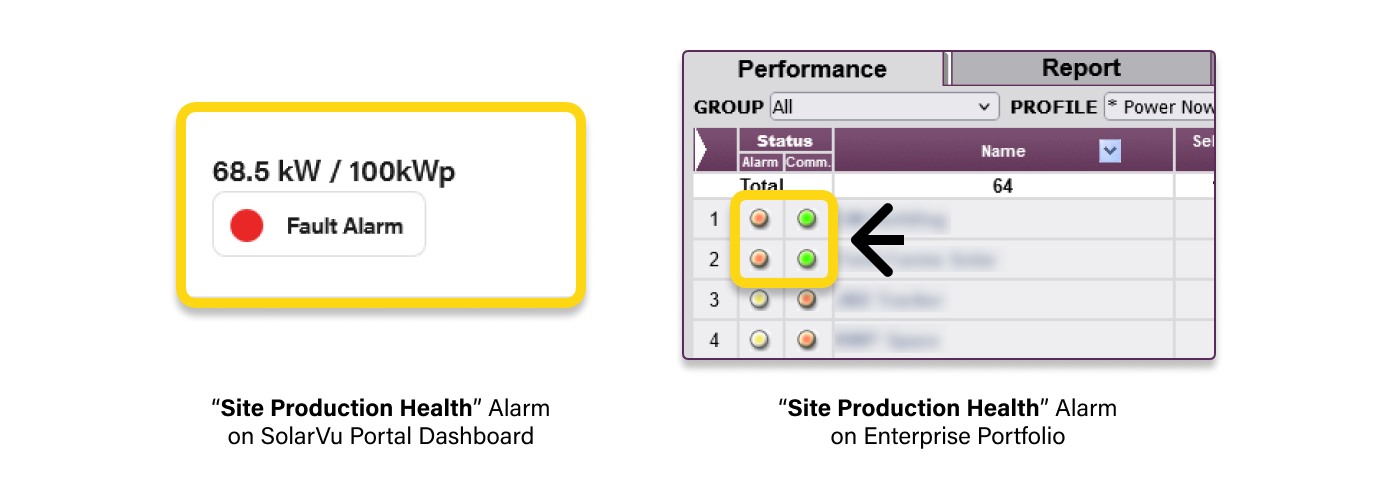
Site Production Health Alarms
Similar to Communication Alarms, these alarms are visible in Daily and Monthly Report Emails, Alarm Emails, and on the SolarVu® Portal Dashboard. They specifically communicate issues related to site production health.
Detected Alarms -> These alarms are identified by Cachelan hardware and the SolarVu® Analyzer’s O&M features which by cross referencing equipment performance and threshold/trigger settings provided and uploaded to the SolarVu® Portal, might indicate that an issue affecting performance has occurred which might not be picked up specifically as an internal fault by onsite equipment.
In order to be informed of alarms on your SolarVu® Portal, emails must be saved and configured to receive either ‘Report’ emails or ‘Alarm’ emails under ‘Setup’.
Alarm Emails on the SolarVu® Portal notify users via email when a potential event that would benefit from the operators’ attention occurs at a site. When an ‘Explicit Fault Alarm’, or a ‘Detected Alarm’ reaches a threshold (persists for a set time), it will create an ‘Alarm Log’ entry on that portal, and will at that time send out an ‘Alarm Email’ to assigned contacts as soon as the problem is identified.
Note: Alarm Emails differ from Output Reports (Daily, Weekly, Monthly).
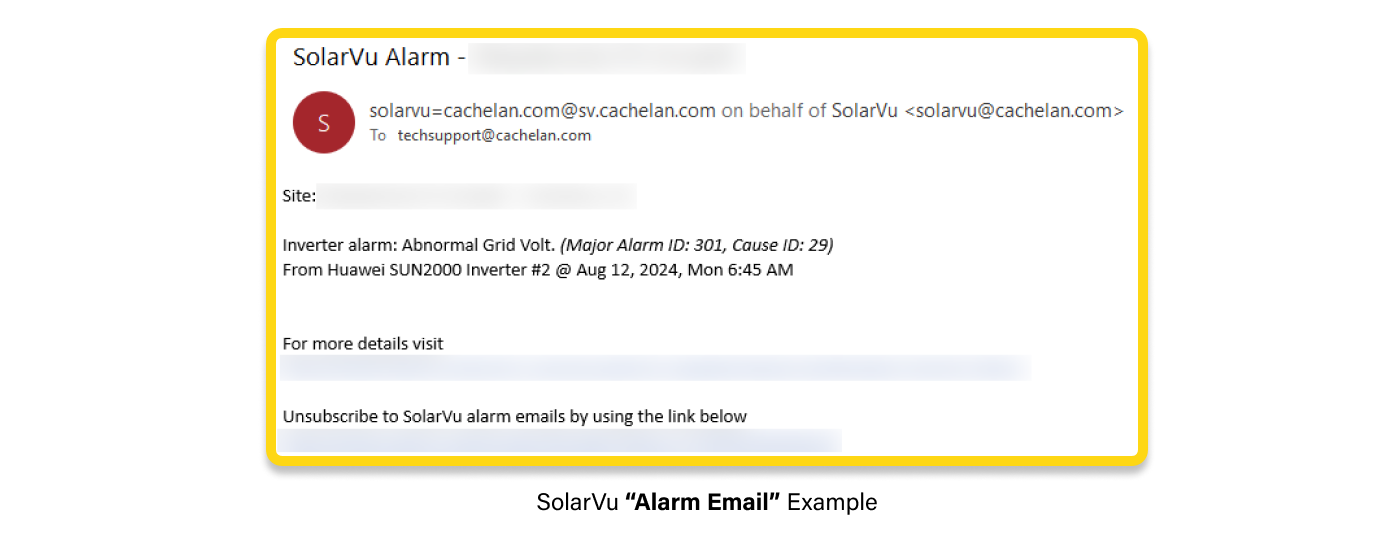
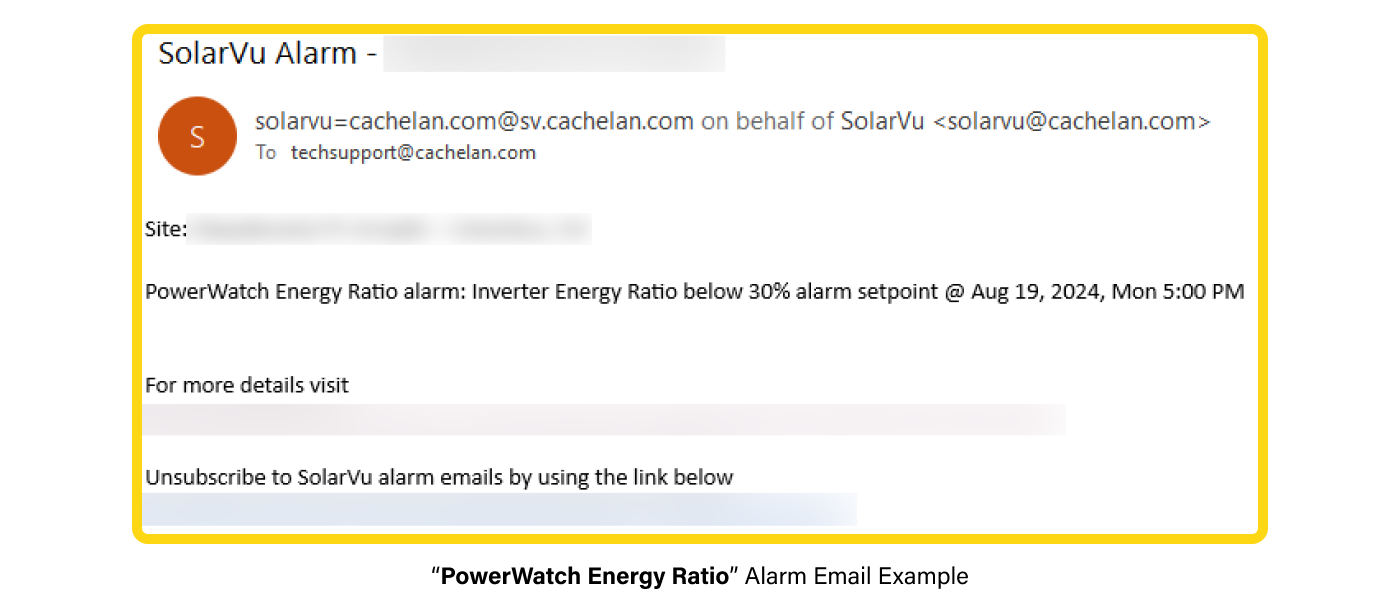
When you receive an email titled ‘SolarVu® Alarm - [Your Site Name],’ it means the SolarVu® Portal has detected or received a signal indicating something unusual or malfunctioning at your solar site that could warrant your attention. The email is intended to notify you of the issue and guide you to the specific area on the SolarVu® Portal or the problematic equipment.
What are Explicit Fault & Detected Alarm Categories?
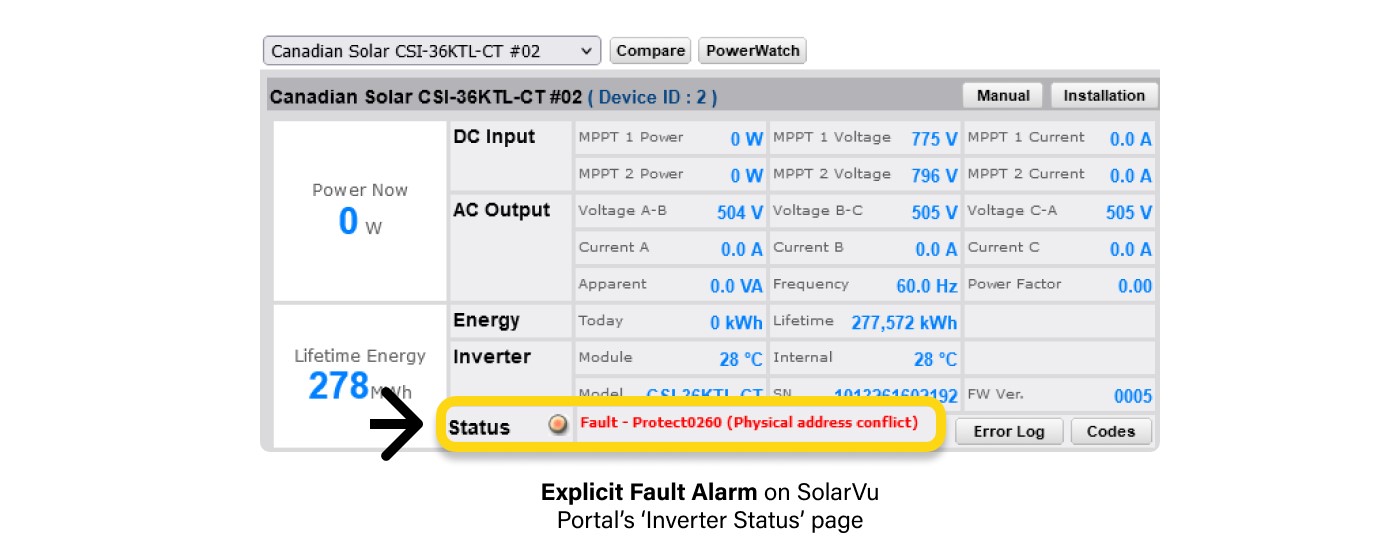
Explicit Fault Alarms
Given these alarms originate on the individual equipment level, SolarVu is simply logging and passing this along, meaning it generates the alarm and email without waiting for time conditions to be met, like they do for ‘Detected Alarms’.
A great example of Explicit Fault Alarm is the classic inverter fault - when device internally detects the problem like an arc fault or loss of AC grid power, and Cachelan’s system reads and surfaces this through the 'Alarms' system.
PowerWatch Energy Ratio Alarms: Based on the fact that inverter generation should track together (normalizing for inverter size), in the event there is a sustained deviation, Cachelan’s “Alarm” system generates an alarm as that would indicate a potential impact on generation which may not be an ‘Inverter fault’.
Scenario: Three inverters on a site, should generate the same % of their kWp throughout the day. In the event one inverter generates half of its peers, this would trigger a ‘PowerWatch’ alarm.
WeatherTrak ‘SunLowPower/SunNoPower’ Alarm: When a site has a weather sensor which measures real time sunniness (irradiance), given irradiance can be roughly considered to be tracked against a full sun ‘1000 W/m2’ as 100% (approximately), if the sensor is measuring 800 W/m2, through the peak periods of the day, but the inverter is generating only 20% of its kWp, this would be an example which would trigger a ‘SunLowPower’ alarm, as the inverter is functioning ‘normally’ without fault, but not the expected amount of DC energy is coming into the inverter as input.
Instead of identifying explicit faults, Detected Alarms are designed to catch potential issues by detecting anomalies in generation and production that might otherwise go unnoticed.
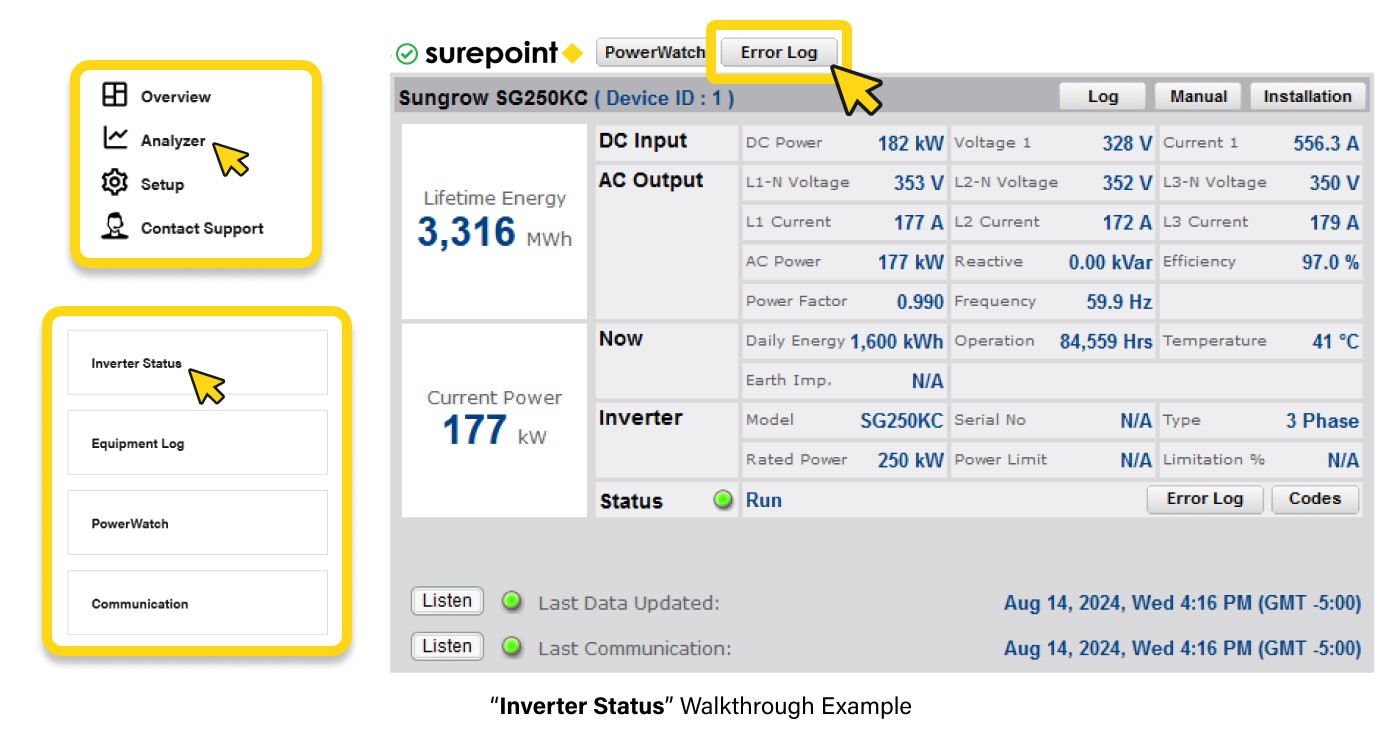
Diagnosing and Understanding an Issue - Example Walkthrough of an Explicit Fault
Step 1: Access the Issue
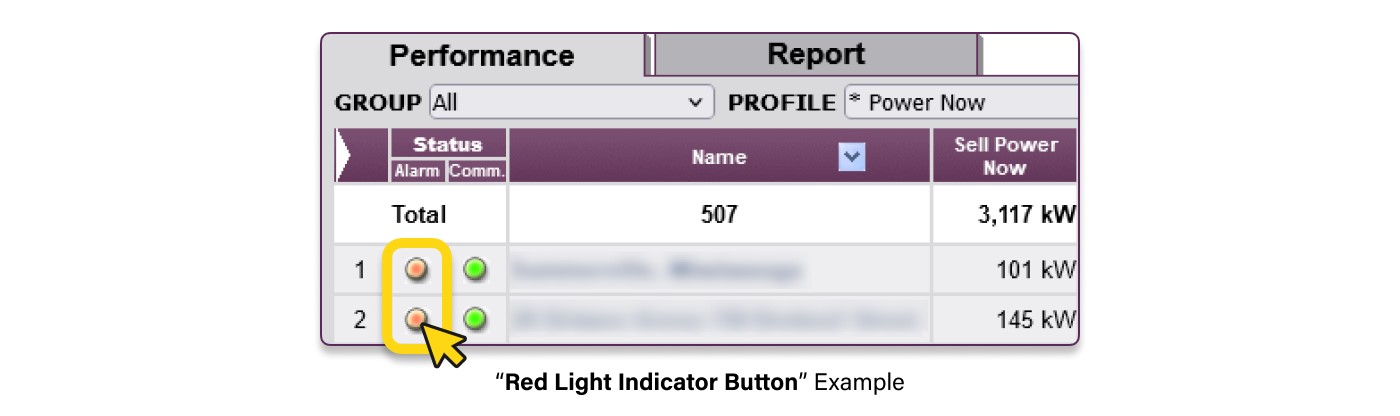
There are several ways to navigate to the fault information:
Diagnosing and issues - Example Walkthrough of a “No Communication” Alarm
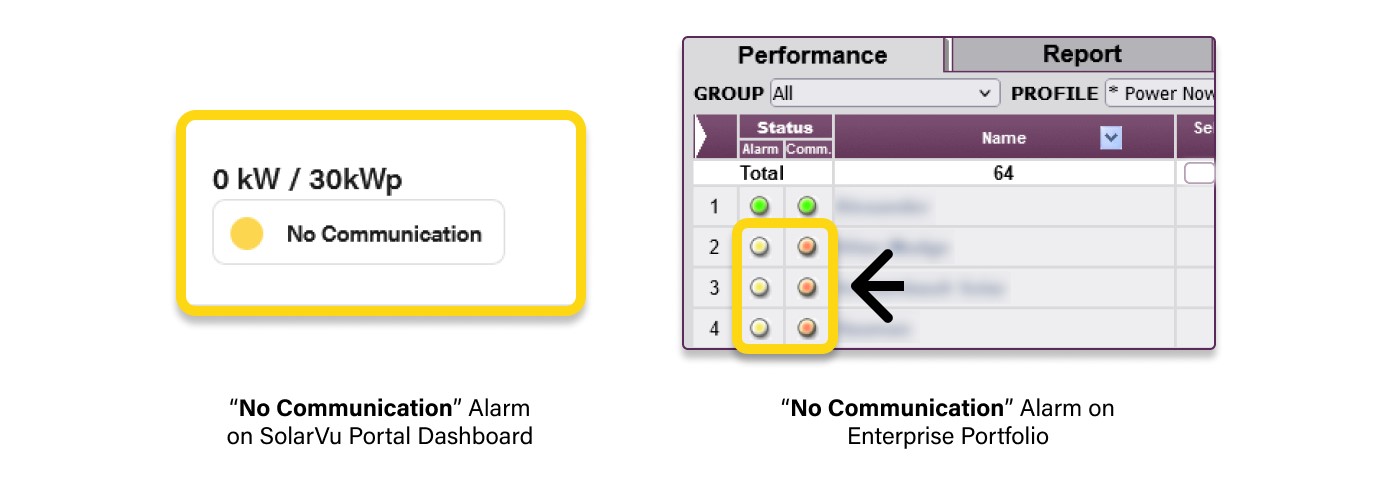
A "No Communication" alarm signals that at least one Cachelan hardware device, such as a gateway or modem, has lost communication, often due to an internet connection issue. The steps below can help streamline the troubleshooting process and positively impact issue resolution:
Diagnosing and Understanding an Issue - Example Walkthrough of a “No Data Received” Alarm
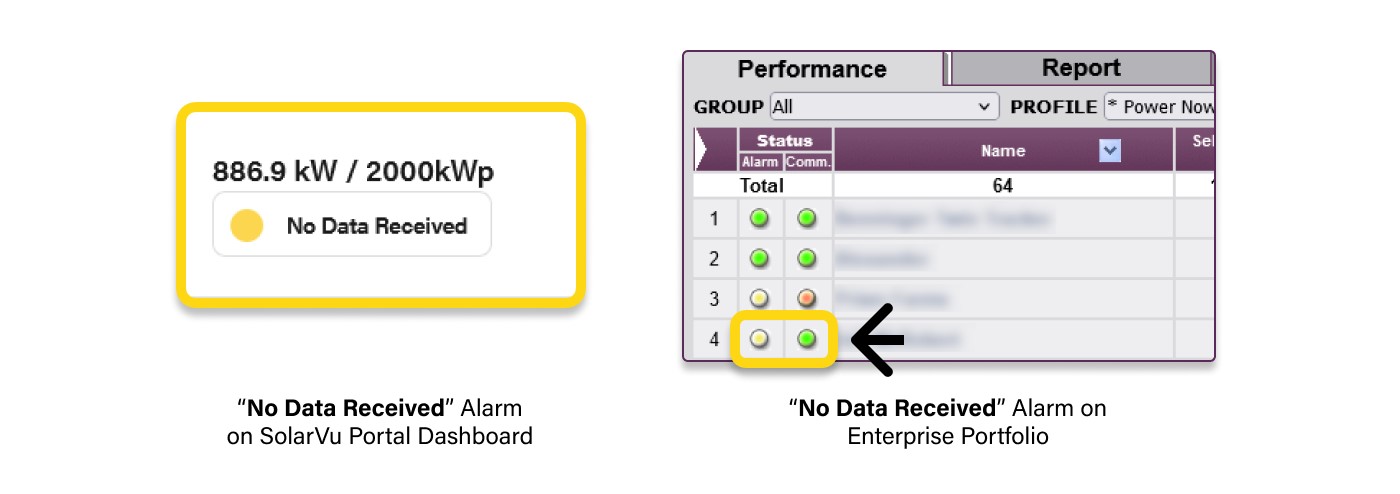
A "No Data Received" alarm indicates that Cachelan's requests for data from the target device(s) are not being fulfilled, signaling potential issues with the onsite equipment that need diagnosis for errors or malfunctions. Before dispatching a technician to the site, SolarVu Portal users can follow these steps to make a more informed decision:
Check the wiring between the Cachelan gateway and the target device to ensure proper connections.
Ensure the target device is powered on and not in sleep mode.
Verify that the modbus settings in the Cachelan gateway match the device’s settings, including IDs, baud rate, and for TCP connections - check if enabled, check the port and IP addresses.
Noise can disrupt data transmission, especially if multiple devices are sharing the same wire and contributing to interference.
Inspect the communication card or port on both the target device and the Cachelan gateway for possible damage or malfunction.
How to tackle ‘Detected’ Email Alarms/Portal Alarms and what they mean?
To begin, there are several categories of “Detected” Alarms, each of which are triggered making use of different equipment/addons supplied by Cachelan and SolarVu® Portal’s integrated features that are a part of Analyzer O&M toolkit - WeatherTrak, SmartStrings and PowerWatch.
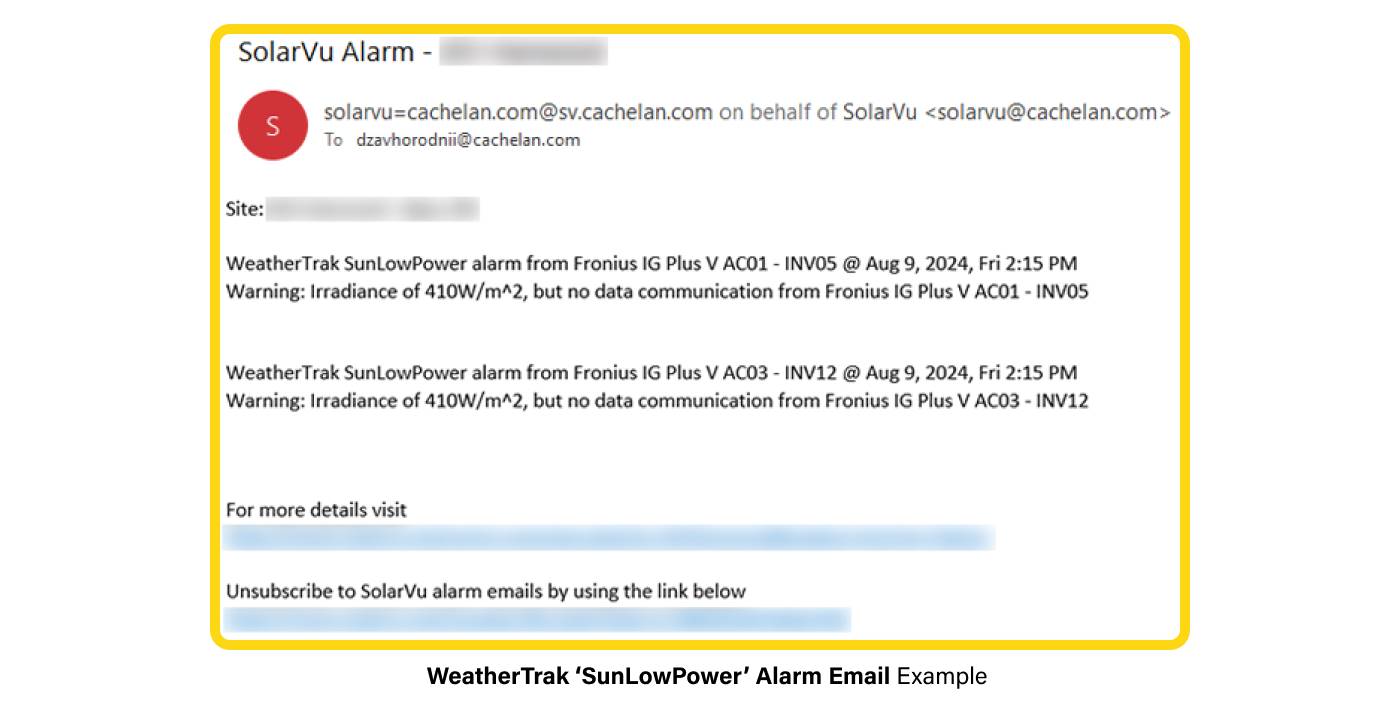
The 'SunLowPower' alarm is available for sites equipped with WeatherTrak addon, which could be a Cachelan-supplied weather station, a retrofitted weather station, or a ‘Virtual WeatherTrak’ (where data is shared from another portal’s weather sensor). This alarm is triggered in the following scenarios:
In the example above, Fronius IG inverters #05 and #12 stopped communicating without generating an alarm. WeatherTrak detected the issue by comparing the current irradiance level with actual power generation, triggering a ‘SunLowPower’ Alarm Email.
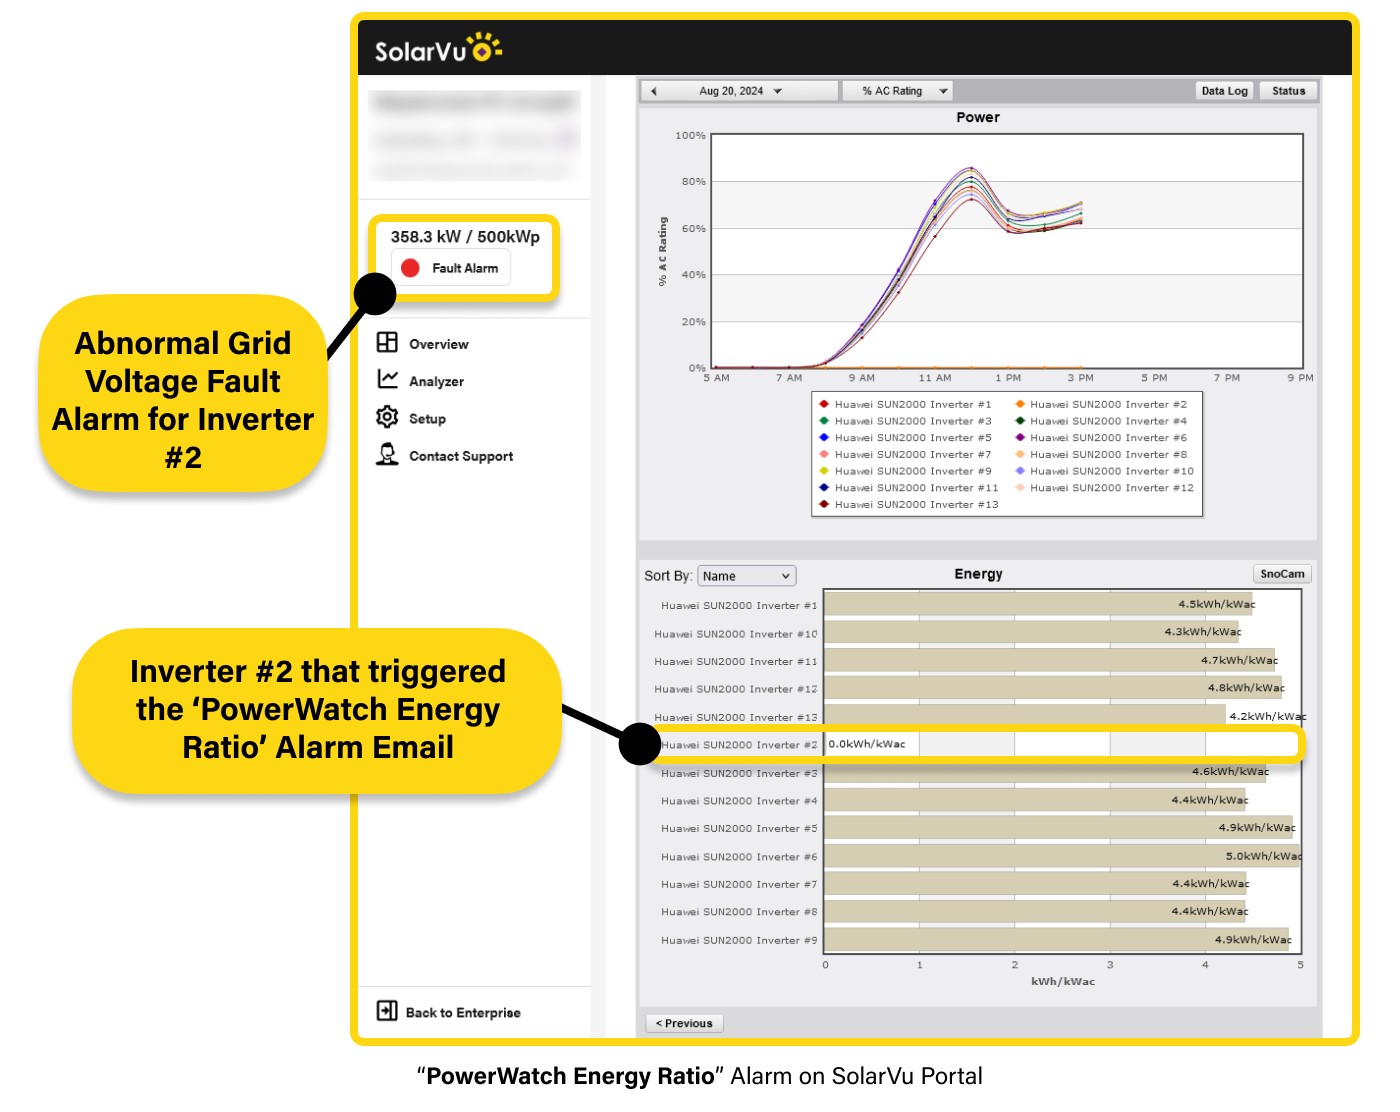
PowerWatch Energy Ratio Alarm
PowerWatch is part of the Analyzer tools, helping to identify inverter-level underperformance by tracking and comparing their relative energy generation. The 'PowerWatch Energy Ratio' alarm is triggered when an individual portal’s ‘PowerWatch thresholds’ are exceeded. When triggered, PowerWatch will:
When investigating the ‘PowerWatch Energy Ratio’ Alarm Email (see example above), it becomes clear that Inverter #12 has both an ‘Explicit’ Alarm and a ‘Detected’ Alarm.
If the inverter hadn’t sent the explicit alarm, the issue might have gone unnoticed. However, PowerWatch triggered the Alarm Email, notifying the owner, and the issue can be identified for investigation.
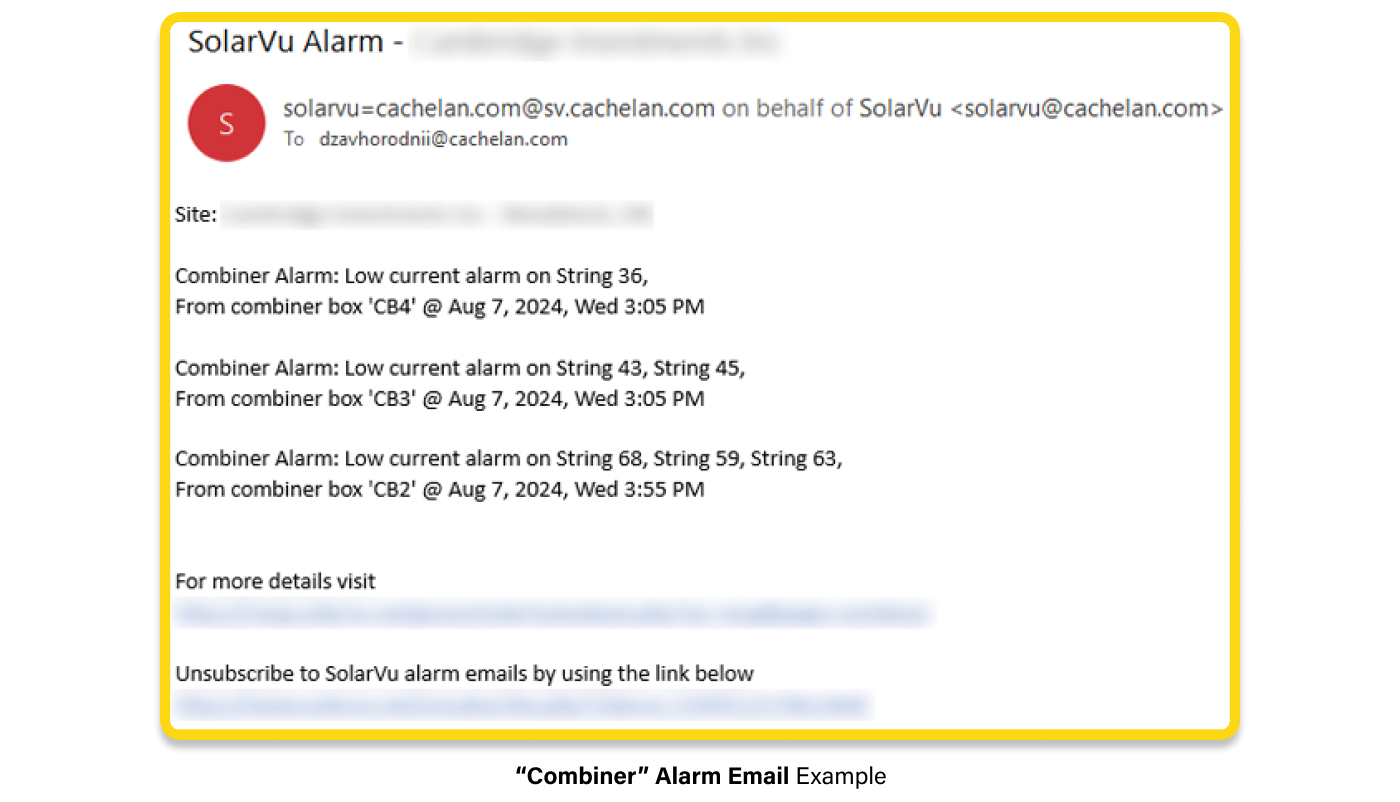
String/LowCurrent & Combiner Alarms
String/LowCurrent alarms, part of the SmartStrings add-on, notify users when specific strings are underperforming by providing details such as the combiner number and the affected string. However, when all strings in a combiner report zero current—due to events like an arc fault shutdown or an open combiner box main switch—no String/LowCurrent alarm is triggered since all strings are reading zero.
To detect such scenarios, a different Alarm Email is used - Combiner Alarms. These alarms function similarly to String/LowCurrent alarms but monitor the total current from all strings within a combiner (also referred to as Zone). Instead of focusing on individual strings, the Combiner Alarm compares the overall current from the combiner to identify significant variations from the expected values.
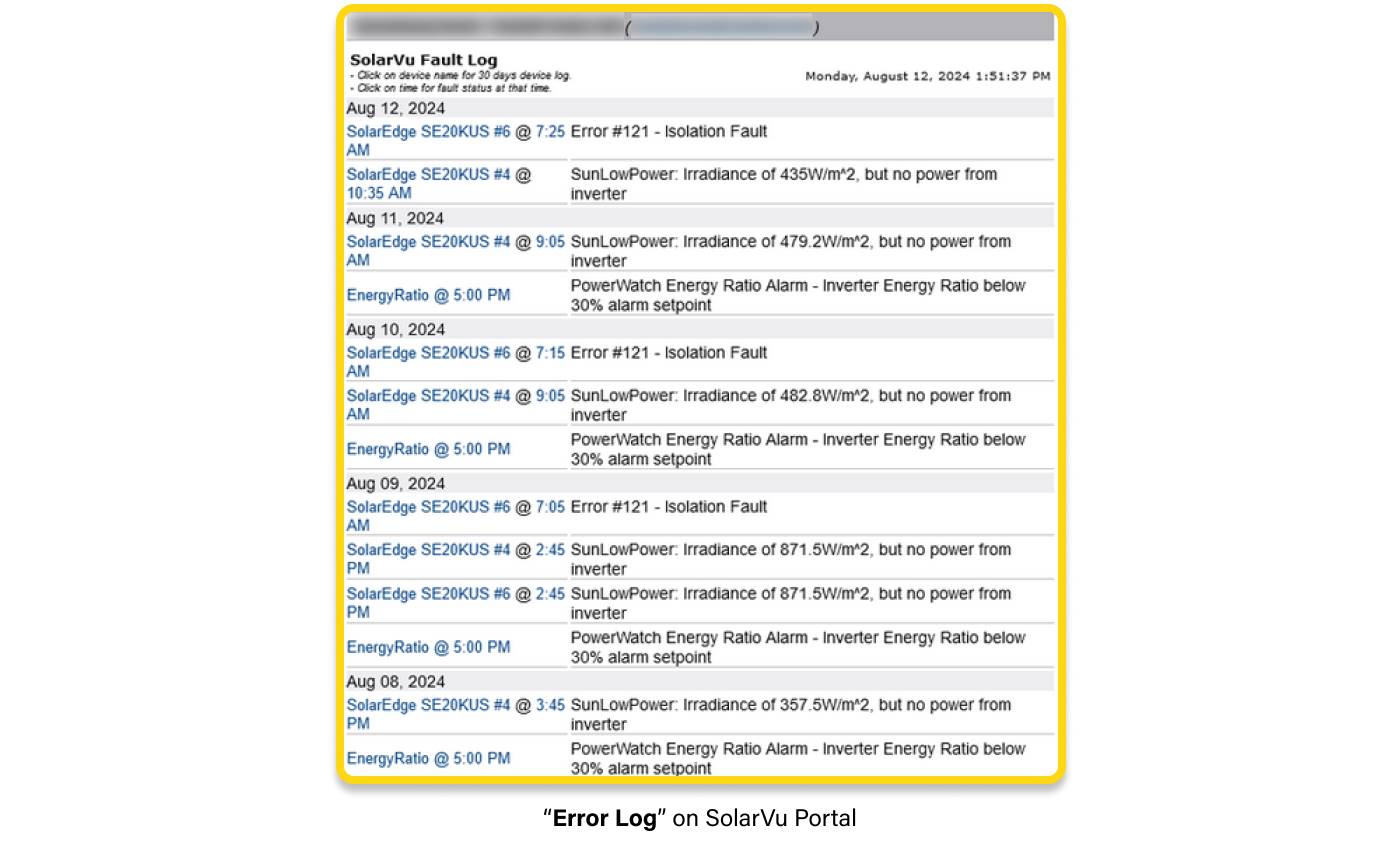
If you happen to miss an alarm and want to review any errors or alarms that went unnoticed, the SolarVu Portal offers an "Error Log" or "Alarm Log" section. This section stores both Explicit and Detected Alarms from the past 30 days. To access this window, follow these steps:
The Alarm System is fully adjustable and it’s effectiveness is dependent on initial setup and users further timely settings modification that reflects current goals and interests of stakeholders which emails are attached/removed/edited in the Email Setup list.
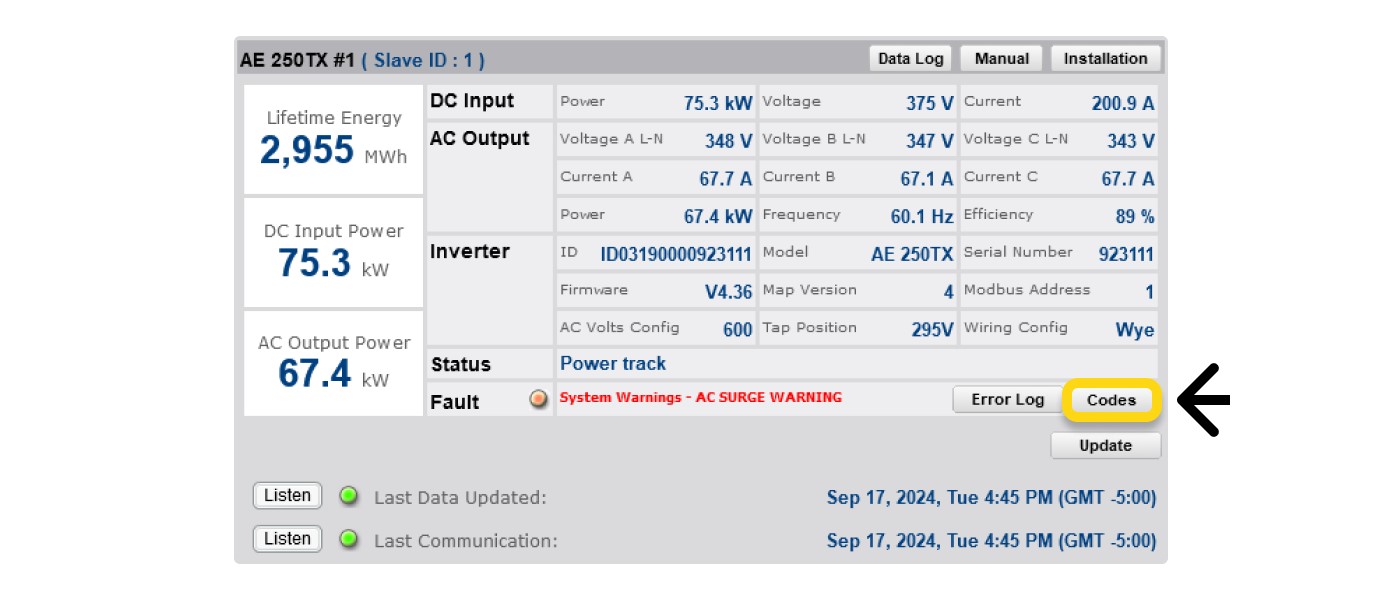
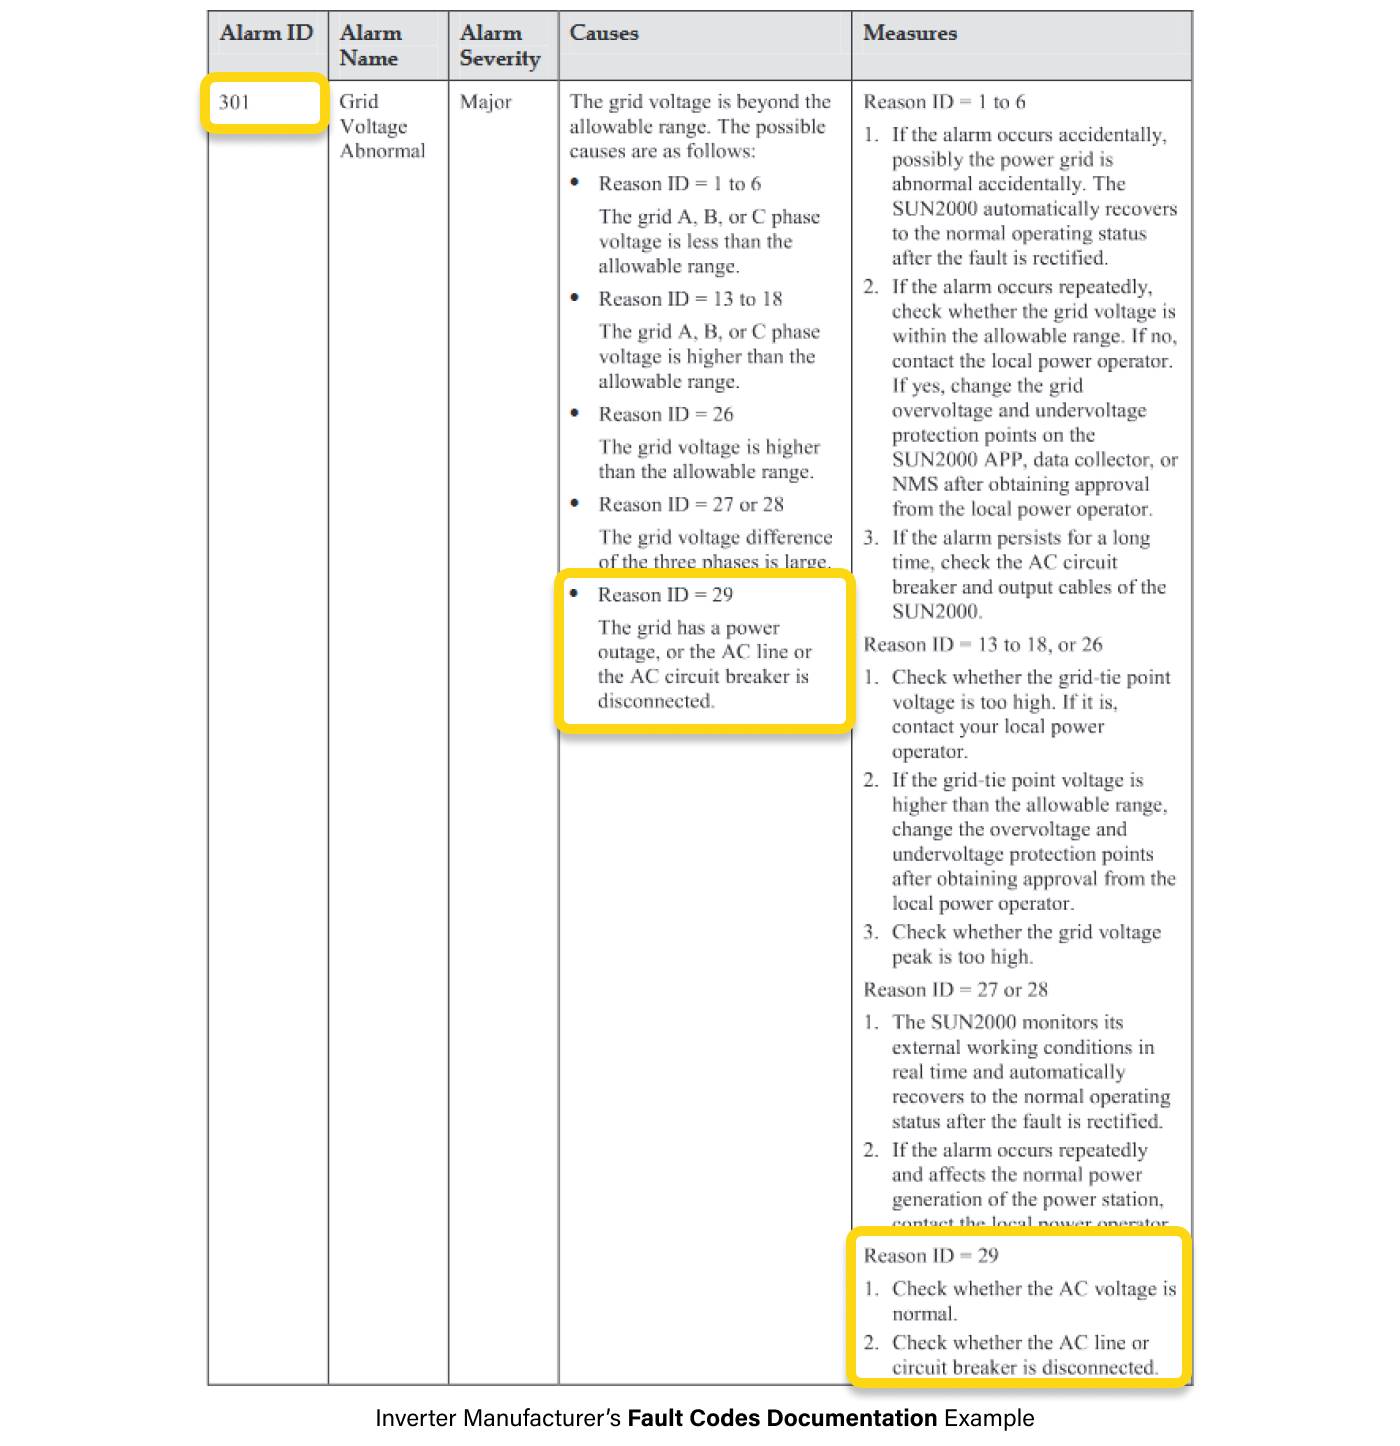
Explicit Alarms are directly triggered by equipment when a predefined condition or threshold is met. These alarms are based on internal, equipment defined ‘fault’ conditions, and each vendor and equipment model has their own codes which need their own interpretation and further digging into.
Detected Alarms
On the other hand, Detected Alarms, also known as 'inferred alarms,' are triggered when potential site issues are identified using SolarVu® Portal’s O&M Analyzer tools (such as SmartStrings, SmartZones, WeatherTrak, PowerWatch, etc.). These tools cross-reference equipment and sensor data, generating an alarm when production in a specific part of the site deviates from normal levels. This signals the need for your operations team to investigate. Unlike Explicit Fault Alarms, Detected Alarms highlight issues that may require attention even if the onsite equipment does not report an internal fault, as they are based on sensitivity thresholds.
Examples include: 

Step 2: Review the Fault Information 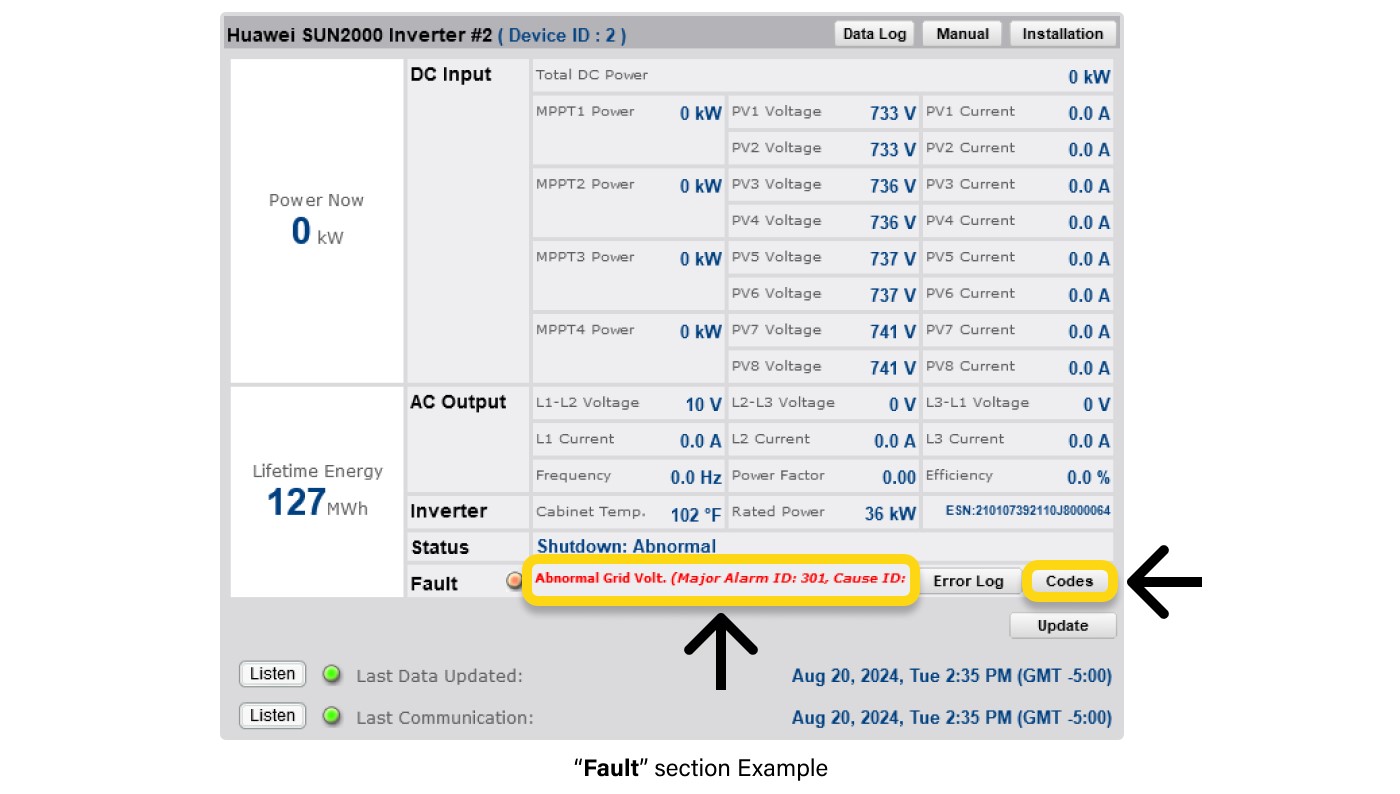
Step 3: Take Action
Step 1: Access the Issue
You can access the "No Communication" alarm from any of the following:
Step 2: Identify Communication Stop Time of gateway(s) which have stopped communicating
Navigate to the Analyzer->"Communication" page and locate the exact time and date when communication was lost.
Step 3: Gateway status light self-check
Make a note of the blinking lights on the Cachelan gateway for a reference starting point as this information will greatly inform next steps.
Step 4: Test Internet Source
Use a laptop to verify the internet connection of the ethernet provided to the gateway at the site to ensure it’s functioning properly.
Contact Cachelan Tech Support
Reach out to Cachelan Tech Support for further troubleshooting instructions.
Step 1: Access the Issue
To begin diagnosing the "No Data Received" alarm, access the issue from one of the following:
Step 2: Identify the Equipment
Navigate to the Analyzer-> "Equipment Log" page and identify which devices have stopped sending data.
The following are common causes and initial steps to troubleshoot (you can also reach out to Cachelan Tech Support for further assistance):
- Wiring Connectivity Issues
- Power Issues
- Modbus Configuration Mismatch
- Noise on the Serial Line
- Comm Card/Port Failure
SunLowPower Alarm
Viewing a list of recent Alarms/Errors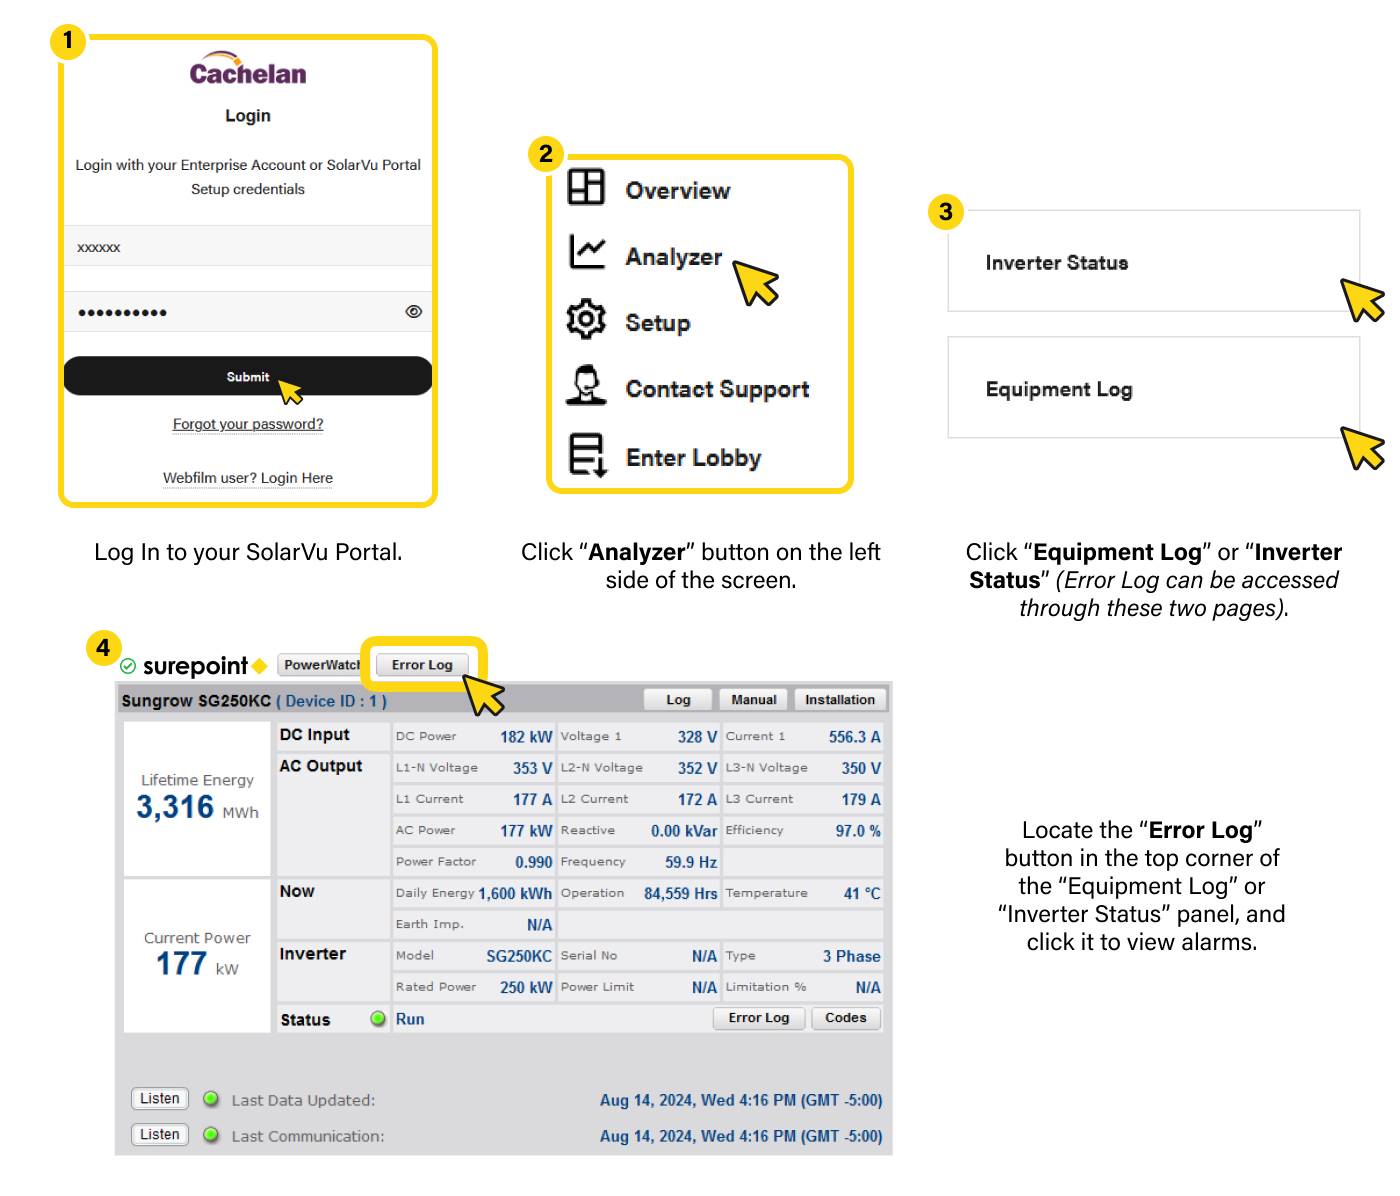
What onsite physical events can trigger a SolarVu® Alarm?
Some reasons that customers have come across which have triggered alarms include, but are not limited to:
To sum up, SolarVu® Portal doesn’t provide specific causes of faults or underperformance if equipment doesn’t communicate specific error codes. Rather, it provides tooling that guide, provide answers and information that later on helps to make an informed set of actions that are aimed at issue resolution.